Stocks have shaken off the 5.9% S&P 500 Index drop last Thursday by gaining three days in a row before yesterday’s modest weakness. While researching and reading this week, three charts stood out that tell us quite a good deal about how investors have reacted during this volatile market and what could be next.
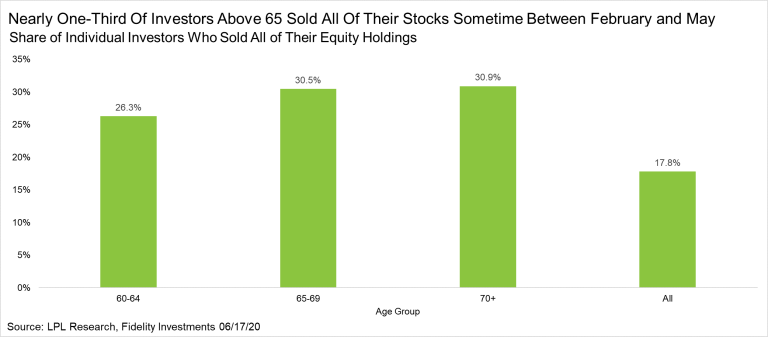
Incredibly, we saw nearly a third of all investors over 65 years old sell their full equity holdings. With stocks now back near highs, this is yet another reason to have a plan in place before trouble comes, as making decisions when under duress can lead to the exact wrong decision.
As shown in the Chart of the Day, according to data from Fidelity Investments, nearly 18% of all investors sold their full equity holdings between February and May, while a much higher percentage that were closer to retirement (or in retirement) sold. Some might have bought back in, but odds are that many are feeling quite upset with the record bounce back in stocks here.

Along these same lines, investors have recently moved to cash at a record pace. In fact, there is now nearly $5 trillion in money market funds, almost twice the levels we saw this time only five years ago. Also, the past three months saw the largest three-month change ever, as investors ran to the safety of cash. If you were looking for a reason stocks could continue to go higher over the longer term, there really is a lot of cash on the sidelines right now.

Last, we noted last week that the extreme overbought nature of stocks here is actually consistent with the start of a new bull run, not a bear market bounce, or the end of a bull market. Adding to this, the spread between the number of stocks above their 50-day moving average and 200-day moving average was near the highest level ever. Think about it; with the 45% bounce in the S&P 500, many stocks were above their 50-day moving average, but not nearly as many were above their 200-day moving average. So from a longer-term perspective, there could still be gains to be had.
Sure enough, looking at other times that had wide spreads, they took place near the start of major bull markets. Near-term the potential is there for a well-deserved pullback, but going out 6 to 12 months, stocks have consistently outperformed.


IMPORTANT DISCLOSURES
This material is for general information only and is not intended to provide specific advice or recommendations for any individual. There is no assurance that the views or strategies discussed are suitable for all investors or will yield positive outcomes. Investing involves risks including possible loss of principal. Any economic forecasts set forth may not develop as predicted and are subject to change.
References to markets, asset classes, and sectors are generally regarding the corresponding market index. Indexes are unmanaged statistical composites and cannot be invested into directly. Index performance is not indicative of the performance of any investment and do not reflect fees, expenses, or sales charges. All performance referenced is historical and is no guarantee of future results.
Any company names noted herein are for educational purposes only and not an indication of trading intent or a solicitation of their products or services. LPL Financial doesn’t provide research on individual equities. All information is believed to be from reliable sources; however, LPL Financial makes no representation as to its completeness or accuracy.
S&P 500 Index: The Standard & Poor’s (S&P) 500 Index tracks the performance of 500 widely held, large-capitalization US stocks.
All index and market data from Factset and MarketWatch.
This Research material was prepared by LPL Financial, LLC.
Securities and advisory services offered through LPL Financial (LPL), a registered investment advisor and broker-dealer (member FINRA/SIPC).
Insurance products are offered through LPL or its licensed affiliates. To the extent you are receiving investment advice from a separately registered independent investment advisor that is not an LPL affiliate, please note LPL makes no representation with respect to such entity.
- Not Insured by FDIC/NCUA or Any Other Government Agency
- Not Bank/Credit Union Guaranteed
- Not Bank/Credit Union Deposits or Obligations
- May Lose Value
For Public Use – Tracking 1-05023694